21.3. GNU Taler monitoring#
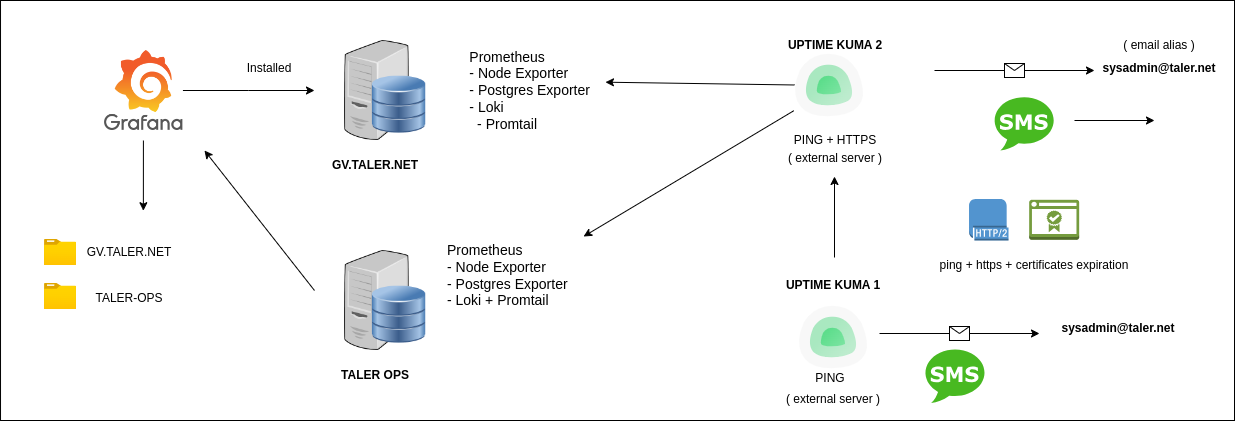
In order to check the availability of our server infrastructure, we use the Grafana and Uptime KUMA monitoring programs.
On the one hand Grafana enables us to see graphically the server consumption resources, and even alert us of some specific situations. On the other hand with a more basic tool such as Uptime KUMA (which does mostly ping and https checks), we get the very first status information, as a very first countermeasure.
21.3.1. Grafana#
Our grafana instance can be reached at https://grafana.taler.net
Our grafana instance is installed on the (TUE) server
21.3.1.1. User accounts:#
We have only two main user accounts:
One “admin” account for server administrators.
One general “read-only” account, for the rest of the team.
21.3.1.2. How to install Grafana#
Please refer to the Grafana official website for installation instructions for your specific operating system. For the specific case of the GNU/Linux distribution Debian 13 (trixie), you can use the next set of instructions.
# apt-get install -y apt-transport-https
# apt-get install -y software-properties-common wget
# wget -q -O /usr/share/keyrings/grafana.key https://apt.grafana.com/gpg.key
# echo "deb [signed-by=/usr/share/keyrings/grafana.key] https://apt.grafana.com stable main" | tee -a /etc/apt/sources.list.d/grafana.list
# apt update
# apt-get install grafana
# systemctl daemon-reload
# systemctl enable --now  grafana-server
Note
If you want to deploy grafana automatically, and if you have access to the –private git repository “migration-exercise-stable.git”, please clone it, and execute from Grafana subfolder the grafana.sh file. This script will install for you Grafana and will leave it up and running on port 3000 of your server.
21.3.1.3. Grafana Dashboards#
As we understand creating tailored Grafana dashboards, is very time consuming thing to do, and in the top of that you really have to to be very proficient to do that, we use the available and pre-built Grafana dashboards, which eventually we can also tweak a little, to fit our needs.
21.3.1.3.1. Node Exporter#
More information can be found on the Node Exporter website.
Dashboard ID: 1860
Note
If you want to deploy Postgres Exporter automatically and have access to the –private git repository “migration-exercise-stable.git”, please clone it, and execute from the subfolder taler.net/grafana/node-exporter.sh, this script will install for you Node Exporter and will leave it running on port 9100. This script also will create, start, and enable on reboot a new service.
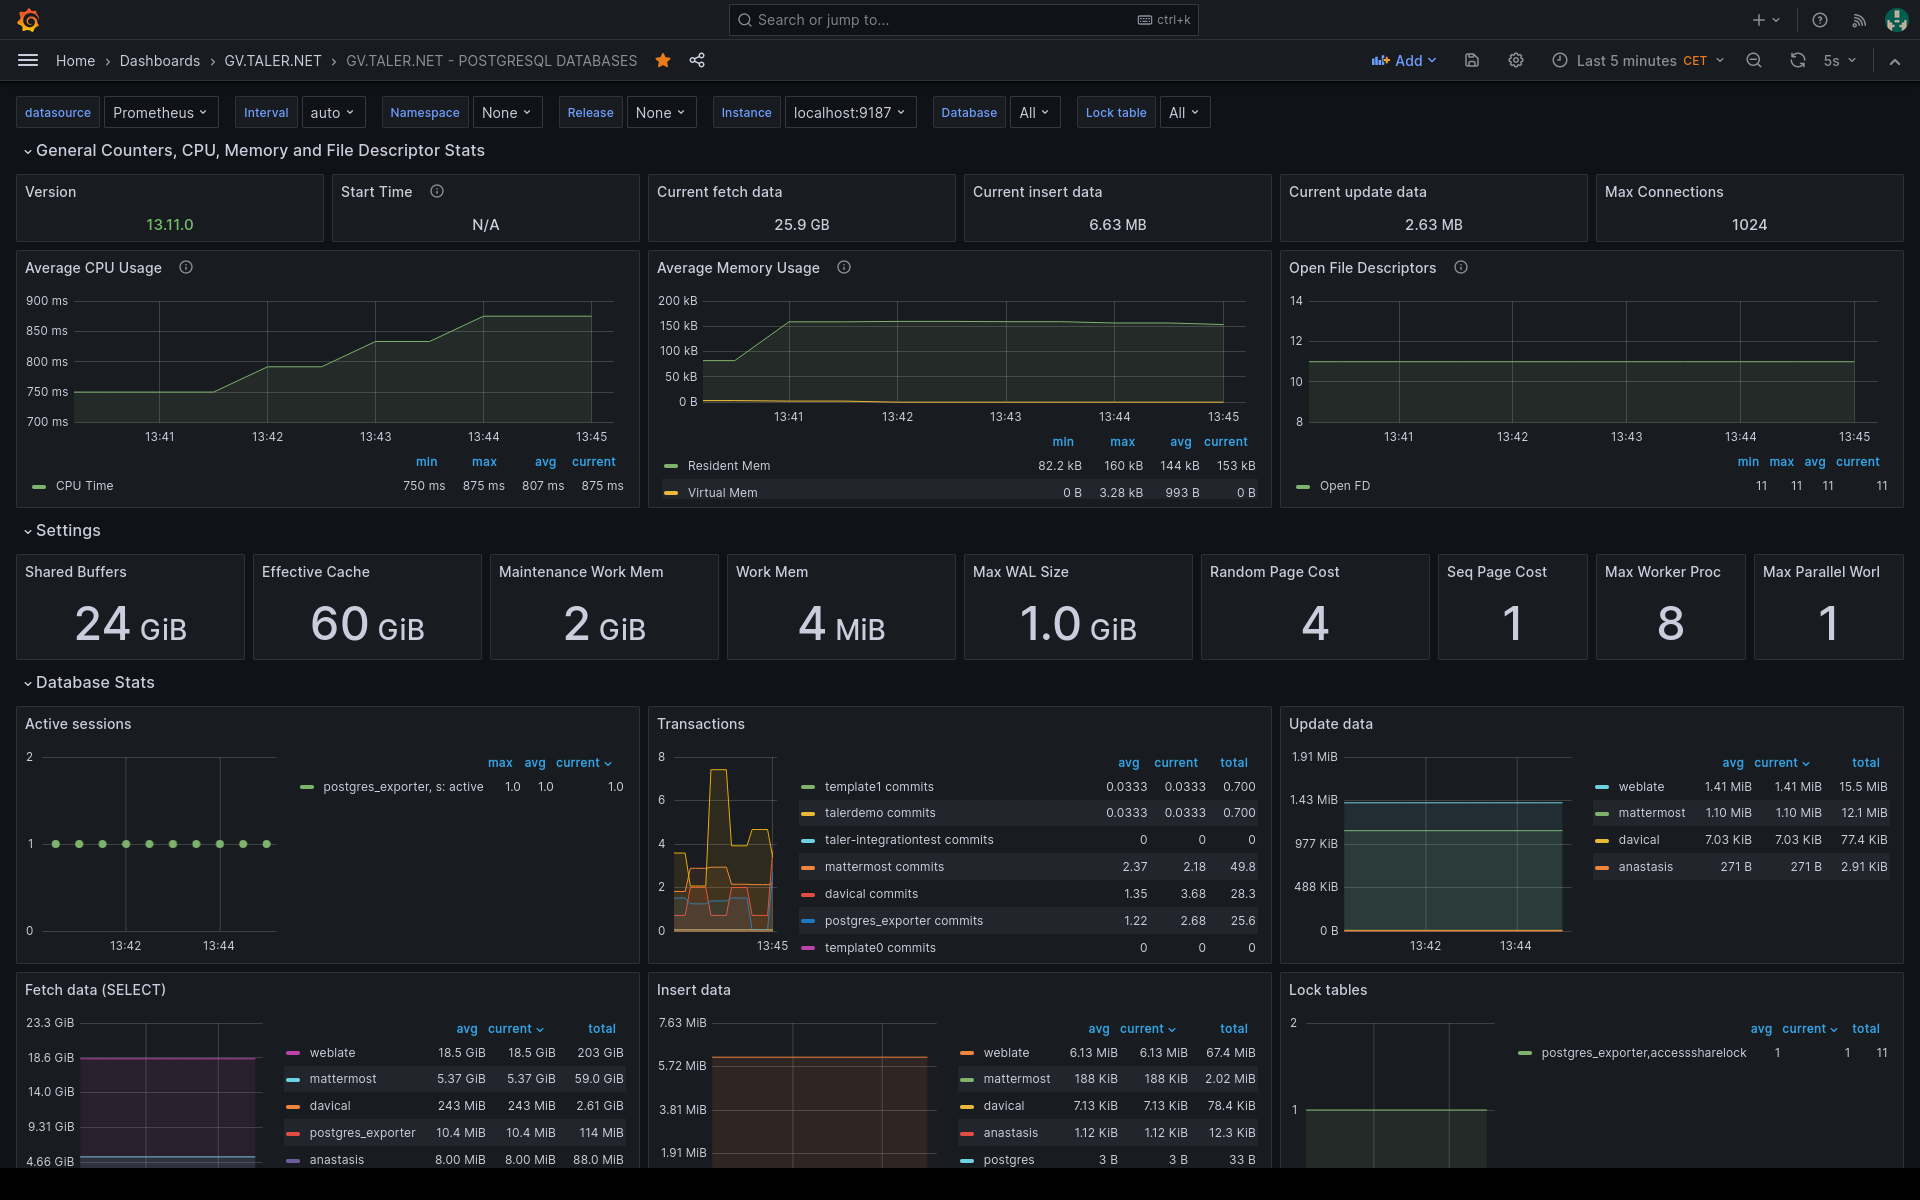
21.3.1.3.2. Postgres Exporter#
More information can be found on the PostgreSQL exporter website.
Dashboard ID: 12485
Note
If you want to deploy Postgres Exporter automatically and have access to the –private git repository “migration-exercise-stable.git”, please clone it, and execute from the subfolder taler.net/grafana/postgres-exporter.sh, this script will install for you Grafana and will leave it running on port 9187.
21.3.1.3.3. Uptime Kuma from Grafana#
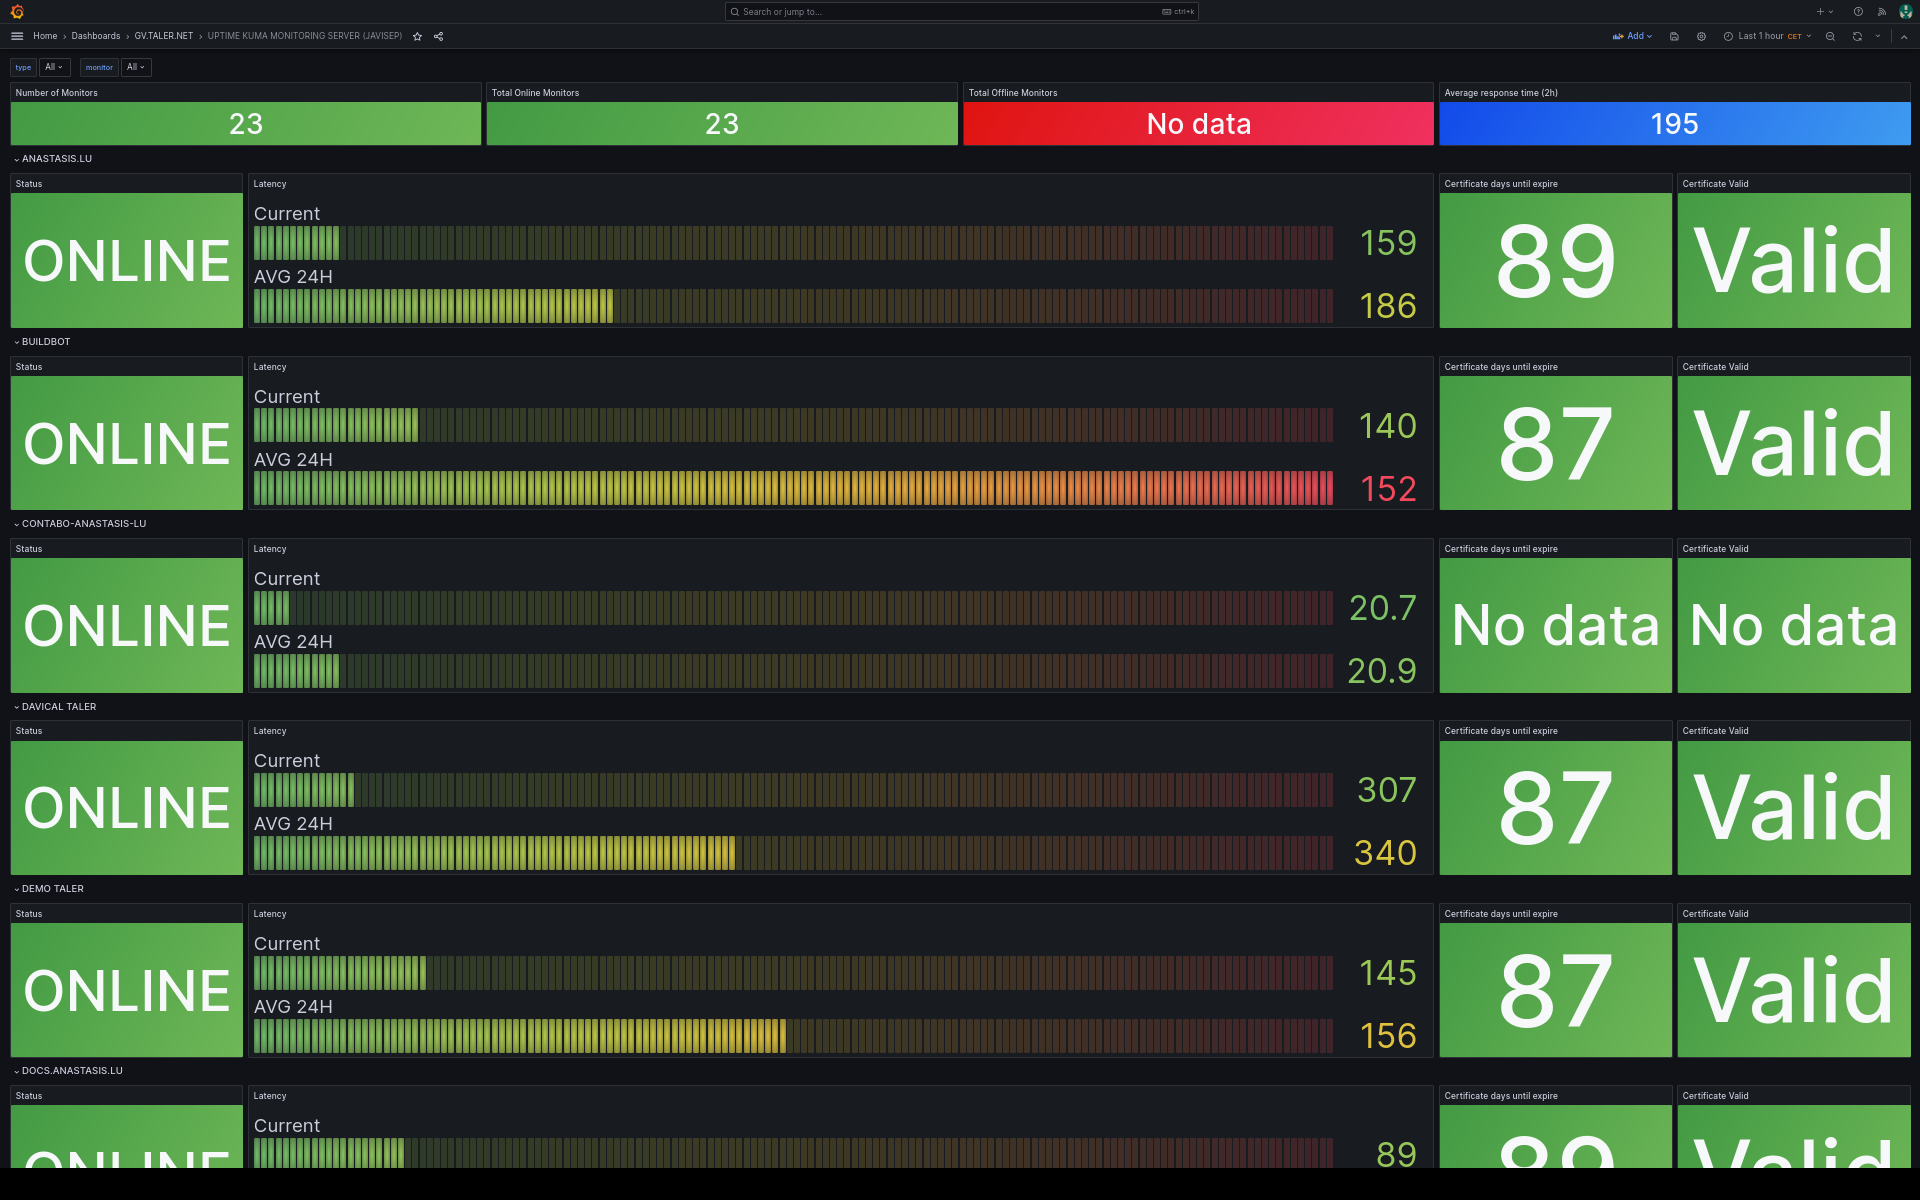
This is an easy to way to integrate all monitored websites from Uptime Kuma, into Grafana. Thus, from the same place (Grafana), you can check also the status of the website and the expiration date of the certificates.
More information can be found on the Uptime Kuma for Grafana website.
Dashboard ID: 18278
21.3.1.4. Grafana Data Sources#
As a data source connector we use Prometheus.
21.3.1.4.1. Prometheus#
More information can be found in the Grafana and Prometheus website.
Note
If you want to deploy Prometheus automatically and have access to the –private git repository “migration-exercise-stable.git”, please clone it, and execute from the subfolder taler.net/grafana/prometheus.sh, this script will install for you Grafana and will leave it running on port 9090.
21.3.1.5. Managing logs#
In order to manage logs, we use Loki + Promtail (Debian packages), which are very easy to integrate with Grafana and Prometheus.
# Install
# apt-get install loki promtail
# Start services
# systemctl start loki promtail
# Enable services on reboot
# systemctl enable loki
# systemctl enable promtail
21.3.1.6. Loki and Promtail services in Grafana#
Make sure you have prometheus running on port 9090
Make sure you have loki running on port 3100
systemctl status prometheus loki
Note
We still don’t have Loki and Promtail installed in production (taler.net), and neither configured to track certain log files.
21.3.1.7. Grafana Alerting#
In order to use the Grafana alerting system rules, you need first to configure working SMTP service of your server.
Once you have done the necessary changes on the Grafana configuration file, you have to either restart or reload the “grafana-server” service with the systemctl command as usual.
Then go to the Grafana admin panel Alerting -> Contact points, and within the email address you are using for this purpose, check if SMTP is indeed working by pressing the “test” button.
If that works, you will receive an email in your mailbox with the Grafana logo confirming that the server can satisfactorily send email messages.
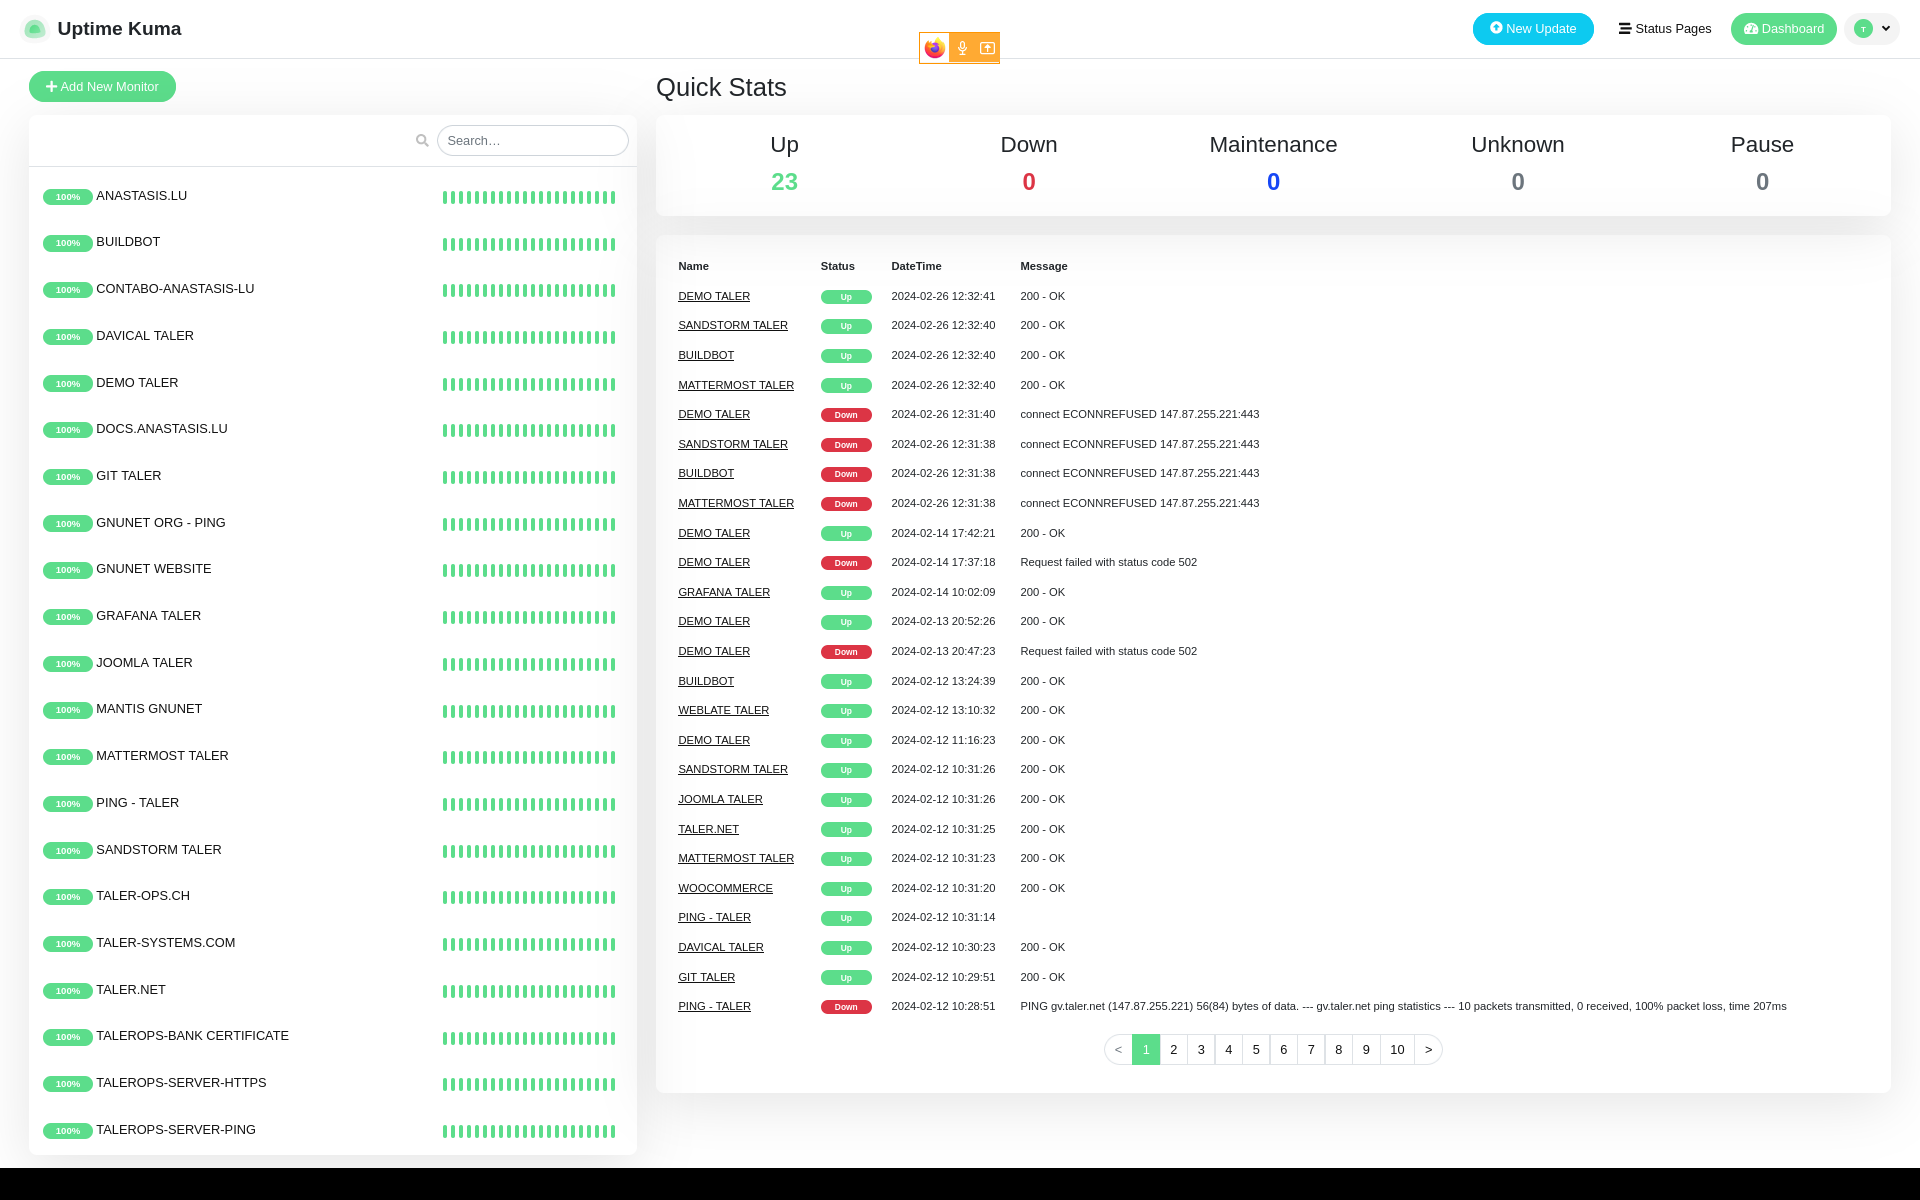
21.3.2. Uptime Kuma#
URL: https://uptimekuma.anastasis.lu (main)
Users: One single administration account with full privileges.
Installation: Without docker. All within the user home folder /home/uptime-kuma
Monitors almost all our servers, websites and certificates expiration dates.
Users: One single administration account with full privileges.
Installation: Without docker. All within the user home folder /home/uptime-kuma
Monitors the “main” uptimekuma installation, to make sure it is up and running, and doing the monitoring properly.
Note
The main uptimekuma installation is under the server anastasis.lu
The second uptimekuma installation on top, is installed on gv.taler.net.
21.3.2.1. Kuma monitor types#
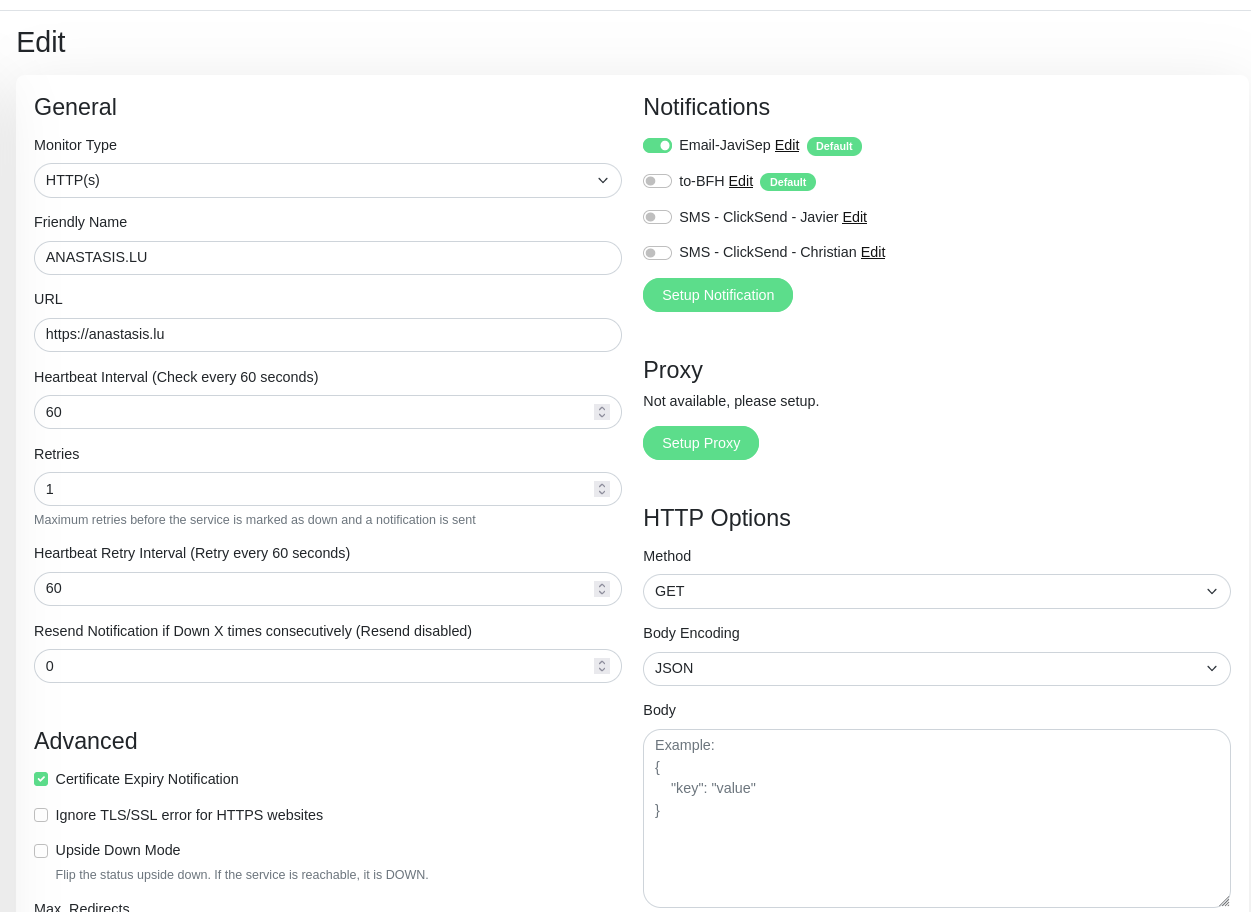
Kuma counts with quite a few monitor types, such as https, TCP port or ping. In our case, we use mainly https requests, and pings, to make sure as a first check that our servers are responsive.
Another handy feature that Kuma has, is the “Certificate Expiry Notification feature, which we also use, and eventually warn us about a certificate expiration dates.
So in brief in our KUMA main server, we use these 3 monitor types (ping,https,certificate expiration) for each website that we monitor.
Exceptionally for high priority notifications for essential services, and specifically due of the importance of the Taler Operations production server, we use in addition SMS notifications (Clicksend provider). This way in the case the main uptimekuma detecting the Taler Operations server unavailability, or any other essential service such as GIt, a SMS message would be sent to the system administrator and eventually some other team member of the deployment and operations department, for urgent action.
How to edit notifications:
